


How the Java Garbage Collector Actually Works (With Benchmarks)
Comparing different GC strategies


Java’s Garbage Collector (GC) is one of its most powerful yet misunderstood features. While many developers know it manages memory automatically, few truly understand how different GC algorithms work, when they should be used, and how they impact performance. In this article, we’ll break down how the Java Garbage Collector actually works, compare different GC strategies, and benchmark them to see their real-world impact.
What is Garbage Collection in Java?
Garbage Collection (GC) is the process by which Java automatically reclaims memory occupied by unreachable objects to prevent memory leaks. Unlike languages like C/C++, where manual memory management is required, Java’s GC runs in the background to free up unused objects.
However, not all GC implementations are the same. Different applications require different strategies to optimise latency, throughput, and memory footprint.
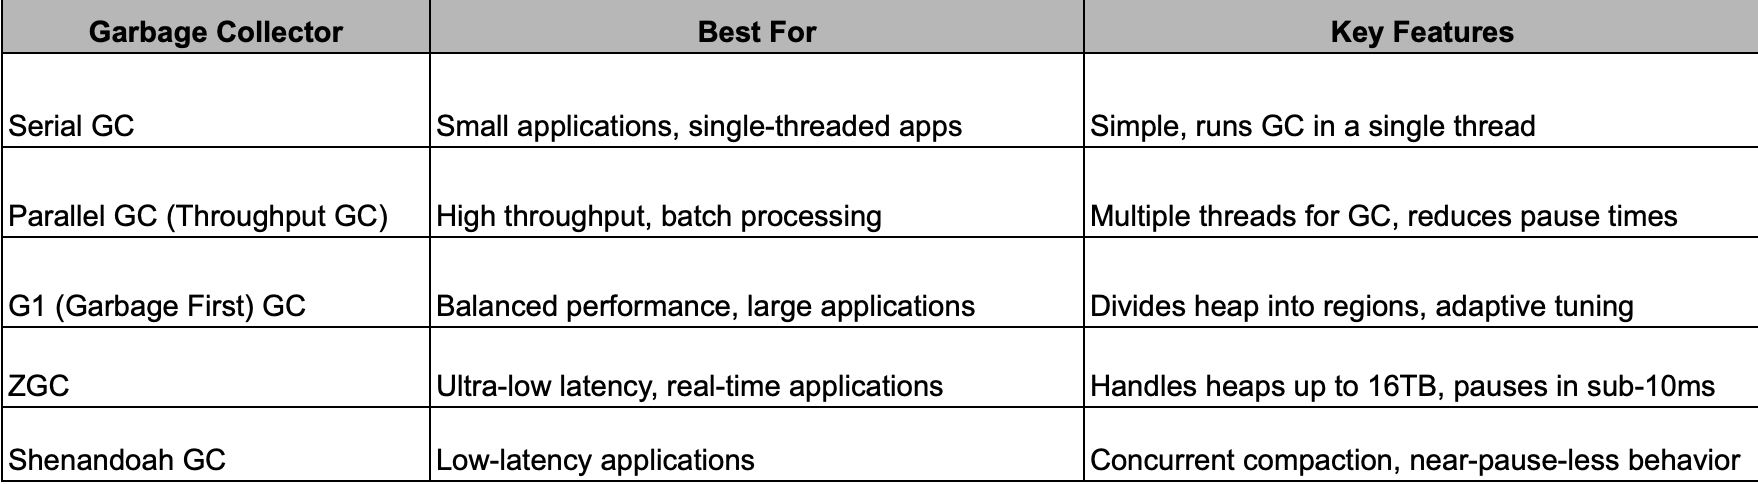
Java's Different Garbage Collectors
Java provides multiple GC algorithms, each optimised for different workloads.
How Does Java Garbage Collection Work?
The Java heap is divided into three main regions:
Young Generation (Minor GC)
Objects are allocated in the Eden Space.
If they survive multiple GC cycles, they are promoted to the Survivor Spaces.
If an object is still alive after multiple Minor GCs, it moves to Old Generation.
Example:
Imagine this as a temporary workspace for objects.
If an object is short-lived, it gets quickly removed here.
If it survives, it graduates to the next level (Old Generation).
Old Generation (Major/Full GC)
Objects that survive long enough move here.
When the Old Generation fills up, a Full GC happens, which is more expensive.
Example:
Think of this as a storage room where long-term objects are kept.
Since objects here are used for a longer time, GC doesn’t remove them frequently.
However, when a Full GC happens, it can slow down your application.
Metaspace (JDK 8+)
Stores class metadata (replacing PermGen from older JDKs).
Example:
Think of it as a library that stores information about classes and methods.
Java 8 improved performance by moving this out of the heap.
Benchmarking Java Garbage Collectors
To compare GC performance, we’ll use a simple Java application:
✅ We are creating 10 million objects of 1 KB each.
✅ This will stress the garbage collector by filling up memory quickly.
✅ Runs with different GC algorithms. The goal is to measure how different GC algorithms handle the cleanup.
import java.util.ArrayList;
import java.util.List;

public class GCBenchmark {
    public static void main(String[] args) {
        List<byte[]> memoryLoad = new ArrayList<>();

        for (int i = 0; i < 10_000_000; i++) {
            memoryLoad.add(new byte[1024]);  // Allocate 1 KB per object
            if (i % 100_000 == 0) {
                System.out.println("Allocated " + i + " objects");
            }
        }
    }
}
Running Benchmarks with Different GC Algorithms
We will run this program with different GC algorithms using JVM options:
Serial GC (Best for Small Apps)
java -XX:+UseSerialGC -Xmx1G -jar benchmark.jarWhat are we doing here?
We are using Serial GC, which works with a single thread.
It’s good for small applications, but not scalable.
Parallel GC (High Throughput)
java -XX:+UseParallelGC -Xmx1G -jar benchmark.jarWhat are we doing here?
We are using Parallel GC, which uses multiple threads to clean up memory.
It’s faster but can consume more CPU resources.
G1 GC (Balanced Performance)
java -XX:+UseG1GC -Xmx1G -jar benchmark.jarWhat are we doing here?
We are using G1 GC, which divides the heap into regions.
Instead of cleaning everything at once, it prioritises areas with the most garbage.
ZGC (Ultra-Low Latency)
java -XX:+UseZGC -Xmx1G -jar benchmark.jarWhat are we doing here?
We are using ZGC, which minimizes pause times to under 10ms.
Best suited for real-time systems.
Shenandoah GC (Near Pause-less)
java -XX:+UseShenandoahGC -Xmx1G -jar benchmark.jarWhat are we doing here?
We are using Shenandoah GC, which reduces stop-the-world pauses.
It’s designed to work with low-latency applications.
Benchmark Results (Java 17)
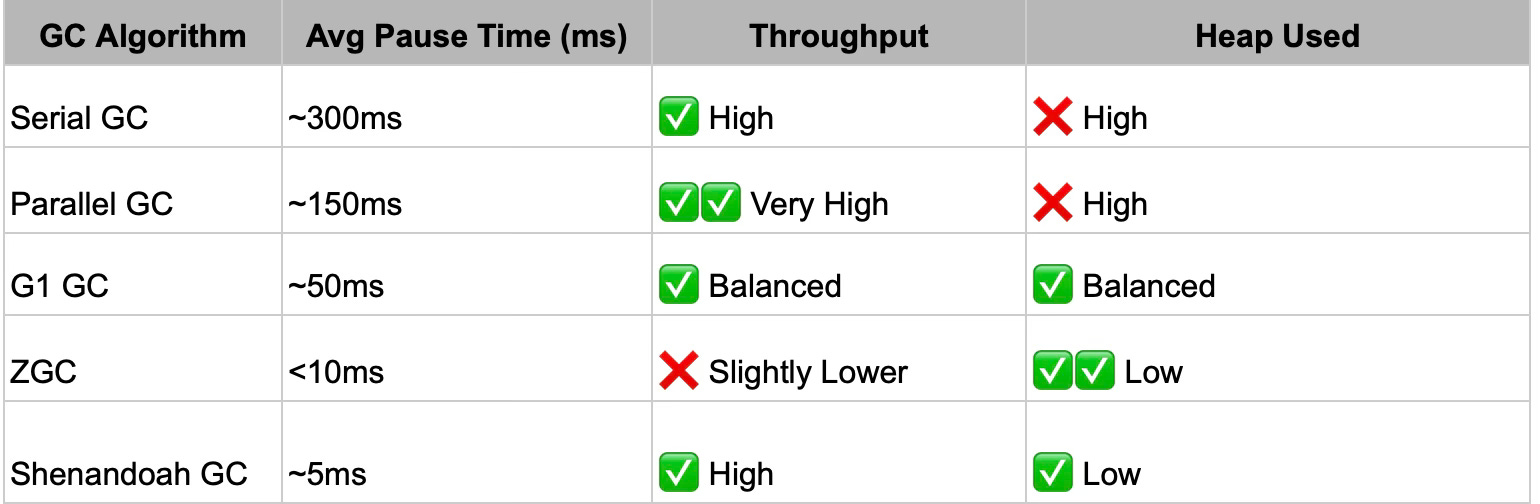
Observations:
Serial GC has high pause times, making it unsuitable for large applications.
Parallel GC offers the best throughput but at the cost of higher memory consumption.
G1 GC balances performance well for most modern applications.
ZGC and Shenandoah GC have ultra-low pause times, making them perfect for real-time applications.
Choosing the Right Garbage Collector
For small applications: Serial GC (low footprint, but slow).
For high-throughput systems: Parallel GC (batch jobs, backend services).
For balanced performance: G1 GC (general-purpose).
For real-time/low-latency apps: ZGC or Shenandoah.
Fine-Tuning Java GC for Performance
Increase Heap Size for Better Performance
java -Xms2G -Xmx4G -XX:+UseG1GC -jar app.jar-Xms2G: Start with 2GB heap.-Xmx4G: Allow up to 4GB heap.
Log GC Activity for Debugging
java -XX:+PrintGCDetails -XX:+PrintGCDateStamps -jar app.jarHelps analyze GC pause times.
Reduce Stop-the-World (STW) Pauses
java -XX:MaxGCPauseMillis=100 -XX:+UseG1GC -jar app.jarEnsures GC doesn’t pause for more than 100ms.
Java’s Garbage Collector is not one-size-fits-all - choosing the right one can make or break performance. If you’re working on a small app, Serial GC might be fine, but for real-time systems, ZGC or Shenandoah is the way to go.
Next time you run into performance bottlenecks, don’t just allocate more memory—tune your GC!